Become an Expert Part 4: Adding Charts to Analyze Sales Data
Part 4 Overview
In this series, we will create a Sales Management application to show how easily anyone can "Become an Expert". Up to this point, we have created a sales data list using C1FlexGrid (part of ComponentOne Studio for WinForms), as well as added exporting options including Excel, XML and PDF. We've also refashioned the application window to have the Microsoft Office look-and-feel using C1Ribbon.
*See Part One, Part Two, and Part Three before continuing.
Now in part 4, we will use the C1Chart control (also part of Studio for WinForms) to display different kinds of charts. The data from our C1FlexGrid, will be bound and displayed in the C1Chart control.
So let's continue!
Application Set up
We will use the C1Chart control to display charts. Just like before, we need to add the control to the toolbox. Right click on the toolbox and display "Choose Toolbox Items". For details please refer to Part 1.
First, add a new Form to the project. Change the Form to inherit the C1RibbonForm class to match it with the application we created in Part 3. Set the form title and other properties.
Creating another Ribbon Interface
We need to create another Ribbon interface for the new form using the C1Ribbon control.
On the Home tab create three RibbonGroups:

Home Tab
Category
- Select Category combobox
Type
- Chart Type combobox
Display Settings
- 3D Effect checkbox
- Stacked checkbox
- Change Axis checkbox
Refer to Part Three, implementing the Ribbon Interface, for more information on setting up the ribbon.
Display settings for C1Chart
Now let's add the C1Chart control to the form. Drag and drop the C1Chart control onto the new form under the ribbon. Dock the C1Chart control to fill the entire form. The display area for the chart is created!
The next step is to create a BindingSource to use as the data source for the C1Chart control. Place a BindingSource object on the form, named bindingSource1.
We will create a data class in the project called SalesData and place this in a class file called SalesDataList.cs. Members of this data class will be "Date", "Category", "Proceeds", "Payments" and "GrossMargin". Members can be in the form of properties or public variables (Note: In the sample, all the members are properties).
`public class SalesData
{
public SalesData()
{
}
    private DateTime _date = DateTime.Now;
    public DateTime Date
    {
        get { return this._date; }
        set { this._date = value; }
    }

    private string _categoryCode = string.Empty;
    public string CategoryCode
    {
        get { return this._categoryCode; }
        set { this._categoryCode = value; }
    }

    private int _proceeds = 0;
    public int Proceeds
    {
        get { return this._proceeds; }
        set { this._proceeds = value; }
    }

    private int _payments = 0;
    public int Payments
    {
        get { return this._payments; }
        set { this._payments = value; }
    }

    private int _grossMargin = 0;
    public int GrossMargin
    {
        get { return this._grossMargin; }
        set { this._grossMargin = value; }
    }
}`
Set this data class as the data source of the BindingSource we just added to the form above (Note: An array has to be set in the data source, so a List is used).
public class SalesDataList : List
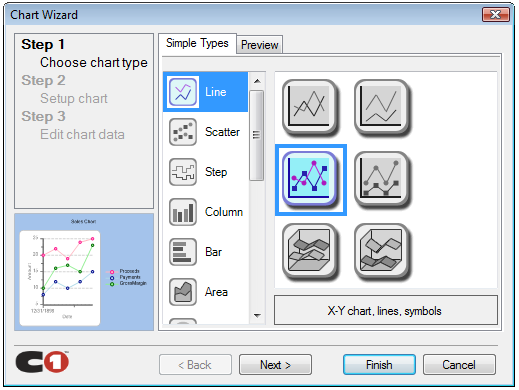
Now let's set more specifics for our chart. Launch the chart Wizard from the C1Chart Tasks (the smart tag).

Follow these settings in the wizard:
- Select chart type
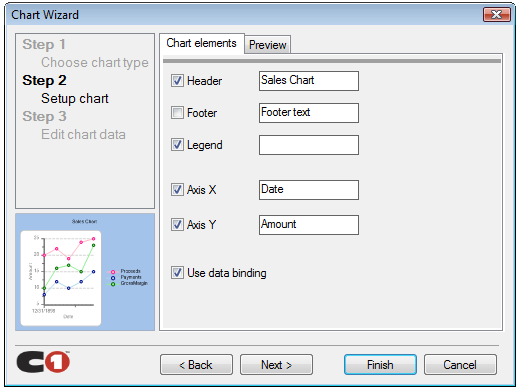
- Set the captions for the chart Header, X Axis and Y Axis
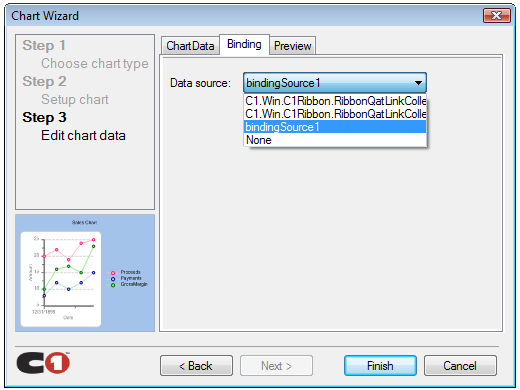
- Select the data source to be displayed in the C1Chart control. Select the bindingSource1 BindingSource created earlier.
- Select which fields to use for data binding for three each of the three data series (Proceeds, Payments and GrossMargin). Each data series' X values will be bound to the Date field.
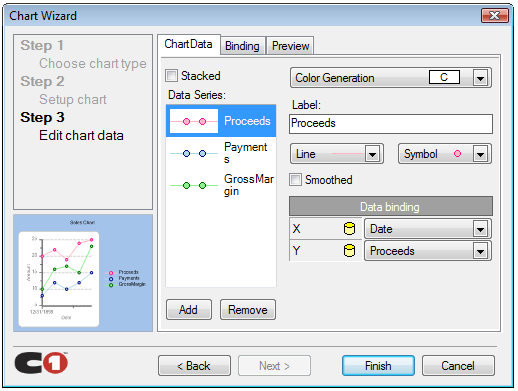


That's it! Click Finish and the chart display settings are complete.
Binding C1FlexGrid data to C1Chart
We will bind the C1FlexGrid data to the C1Chart using the SalesDataList created earlier. The SalesData class is populated from the data displayed in C1FlexGrid on the main form. The SalesDataList class is generated as an array to be fed into the C1Chart.
This property below will be used for the get/set of our SalesData class. Add this property to the chart Form's (Form2) code behind.
private SalesDataList _salesDataList = null;
public SalesDataList SalesDataList
{
    get { return this._salesDataList; }
    set { this._salesDataList = value; }
}
We will also need a category property for our Form2 class. This property will store the selected category on which to chart data from.
private List category;
public List Category
{
    get { return this.category; }
    set
    {
        this.category = value;
        this.initializeCategory();
    }
}
The initializeCategory method should fill the Ribbon combobox with all possible categories.
Now we need to make a few adjustments to the main form. First, add a Chart button to the ribbon, and in its click event, we need to launch a new chart form.

`
Form2 chartForm = new Form2();
chartForm.SalesDataList = this.createDataList();
chartForm.Category = this.category;
chartForm.ShowDialog();
`
We create the SalesDataList pulling data from the C1FlexGrid using this method:
`private SalesDataList createDataList()
{
SalesDataList list = new SalesDataList();
for (int i = 1; i < this.c1FlexGrid1.Rows.Count; i )
{
    if (this.c1FlexGrid1[i, 0] != null
        && (this.c1FlexGrid1[i, 2] != null
        || this.c1FlexGrid1[i, 3] != null))
    {

        SalesData data = new SalesData();
        data.Date = DateTime.Parse(this.c1FlexGrid1[i, 0].ToString());
        data.CategoryCode = this.c1FlexGrid1[i, 1] == null ? "0" : this.c1FlexGrid1[i, 1].ToString();
        data.Proceeds = this.c1FlexGrid1[i, 2] == null ? 0 : int.Parse(this.c1FlexGrid1[i, 2].ToString());
        data.Payments = this.c1FlexGrid1[i, 3] == null ? 0 : int.Parse(this.c1FlexGrid1[i, 3].ToString());
        data.GrossMargin = this.c1FlexGrid1[i, 4] == null ? 0 : int.Parse(this.c1FlexGrid1[i, 4].ToString());
        list.Add(data);
    }
}

return list;
}`
Here, we declare a new SalesDataList and cycle through the C1FlexGrid rows collection filling in the data (so long as it's not null).
Back on Form2, we set the SalesDataList as the data source of the BindingSource.
`
private void setDataSource(string categoryCode)
{
this.bindingSource1.DataSource = this._salesDataList.SelectCategory(categoryCode);
`
Finally, we will show the data based on the category that has been selected. The following code displays only the desired category's data from the data source.
public SalesDataList SelectCategory(string code)
{
        SalesDataList value = new SalesDataList();
        List list = this.FindAll(delegate(SalesData data)
        {
            return (data.CategoryCode == code);
        });
        value.AddRange(list);
    return value;
}
Now when we run the application, our chart form displays data only from the selected category.

Modifying the chart type
The C1Chart control supports all popular chart types. For this application, will be using the Bar and Line chart types.
We will use some simple code with the Chart Type combobox in the Ribbon to select the chart type. We will add two possible values to the combobox: Line and Bar Graph.
The Ribbon combobox's SelectedIndexChanged event will capture when the user changes chart type.
if (this.ribbonComboBox2.SelectedIndex == 0)
       this.c1Chart1.ChartGroups[0].ChartType = Chart2DTypeEnum.XYPlot;
else
       this.c1Chart1.ChartGroups[0].ChartType = Chart2DTypeEnum.Bar;
Here we are simply setting the ChartType property to in the C1Chart control. The Chart2DTypeEnum is set to Chart2DTypeEnum.XYPlot for a line chart and Chart2DTypeEnum.Bar for a bar chart.
When we select Bar Graph we will notice the chart displays this type.

All it takes is changing one property to completely change the chart type with C1Chart.
Printing C1Chart
Now that we have been able to display different types of charts, we will add the feature to print them. We just need to call a simple print method in C1Chart control for this.
this.c1Chart1.PrintChart();
In our sample, we've added a Print button to the Miscellaneous RibbonTab in our chart form. When this button is clicked, we call the PrintChart method and the following print dialog is displayed:

Modifying Other Chart Properties
Let's extend the users options for viewing charted data in C1Chart. The C1Chart control also contains 3D effects and stacked charts. We will include these in the display features available on the UI.
The Use3D property is set for the 3D effect feature. Similarly, the Stacked property is used for the stacked display in a chart. Set the following properties when the user checks or unchecks the 3D Effect and Stacked checkboxes we created earlier.
this.c1Chart1.ChartGroups[0].Use3D = "true/false";
this.c1Chart1.ChartGroups[0].Stacked = "true/false";


As you can see, we get a completely different look for the chart just by easily setting these couple properties.
Finally, let's invert the X and Y axes of the chart. We just need to set the Inverted property to true for the ChartArea.
this.c1Chart1.ChartArea.Inverted = "true/false";

In addition to changing the chart type with just one property, we can also modify other chart settings with only a few properties.
Conclusion
In this section we have charted data from our C1FlexGrid control using C1Chart. Data binding was done through some simple coding and we were able to integrate the features of each control into our application. We further modified many chart display settings using only a few simple properties.
In part 5 we will use more features of C1Chart to further improve our application by integrating it with other controls.
Download Part 4 Sample Project
Points to Remember
This application has been created in Visual Studio 2008 and uses SQL Server 2005 or higher. Installation of .NET Framework 3.5 is a prerequisite for running the sample application.
Acknowledgements
- Article copyright © 2009 Shogo Takayama & Shoeisha Co., Ltd. http://www.shoeisha.co.jp/
- http://codezine.jp/
- These contents were made by GrapeCity inc., Japan. http://www.grapecity.com/japan/
- Translated by Vidhi Kapoor (GrapeCity India Pvt. Ltd.)
- Edited by Greg Lutz (ComponentOne)

Greg Lutz